Software
Our monitoring solution offers a wide range of reports and graphs that are tailored to your needs.
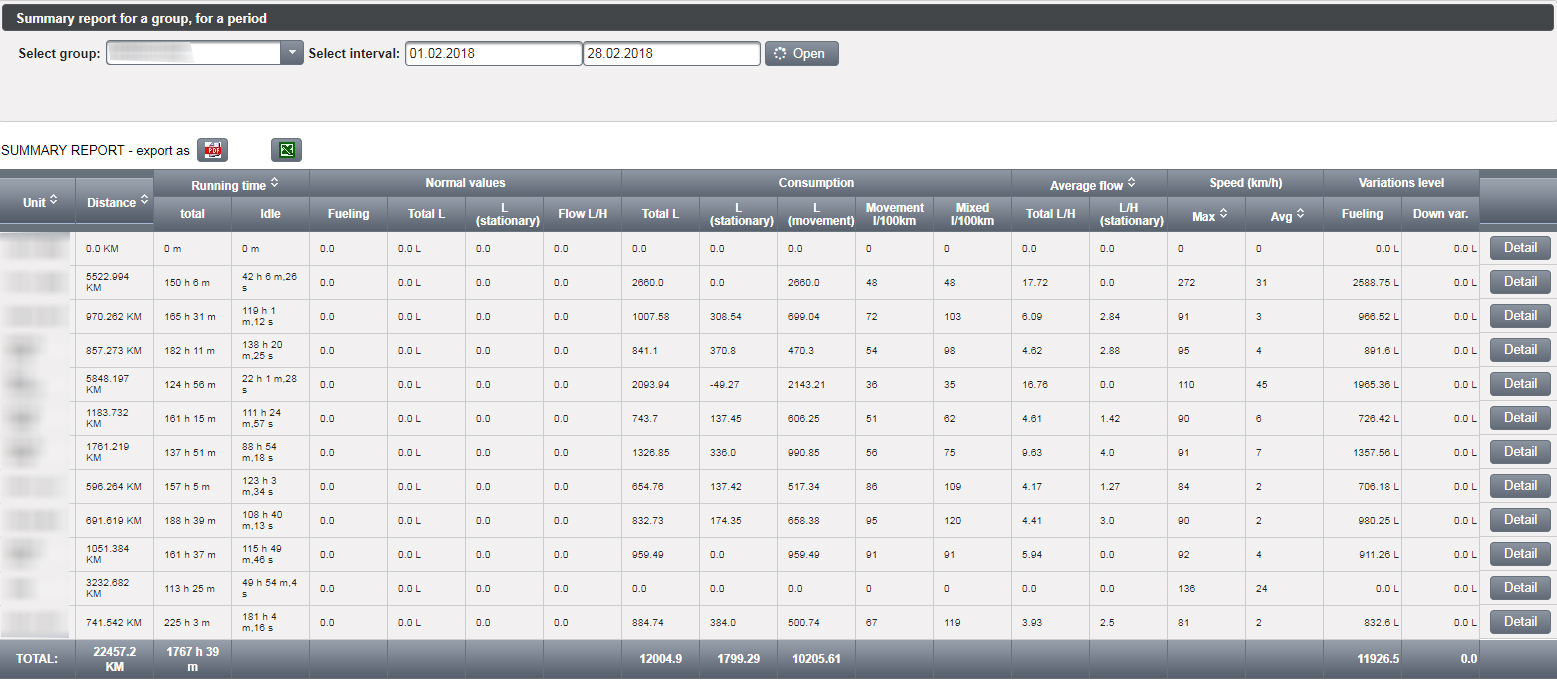
Summary Report
The centralized report provides an overview of the entire outdo park that displays information such as total distance, engine running time, nominal fuel consumption, fuel consumption (in-service liters, running lithographs, liters / 100km, l / h) Total Foods / Strikes.
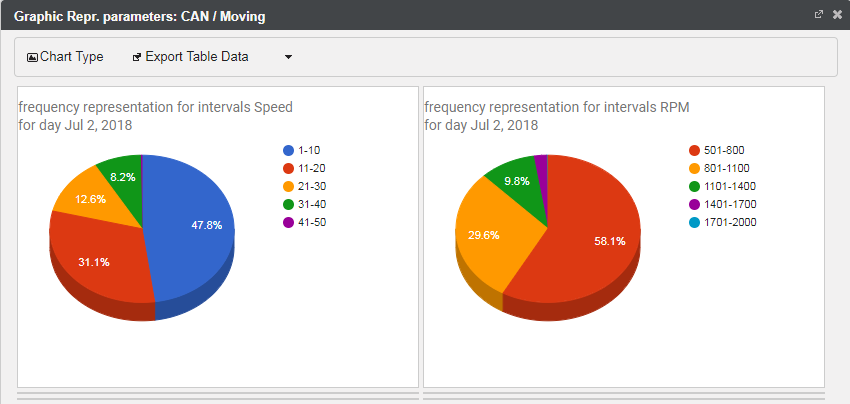
CAN Mapping Chart
The CAN Parameters Chart provides information on how to drive the unit over a time frame. Percent graph with rotations per minute RPM and travel speed.
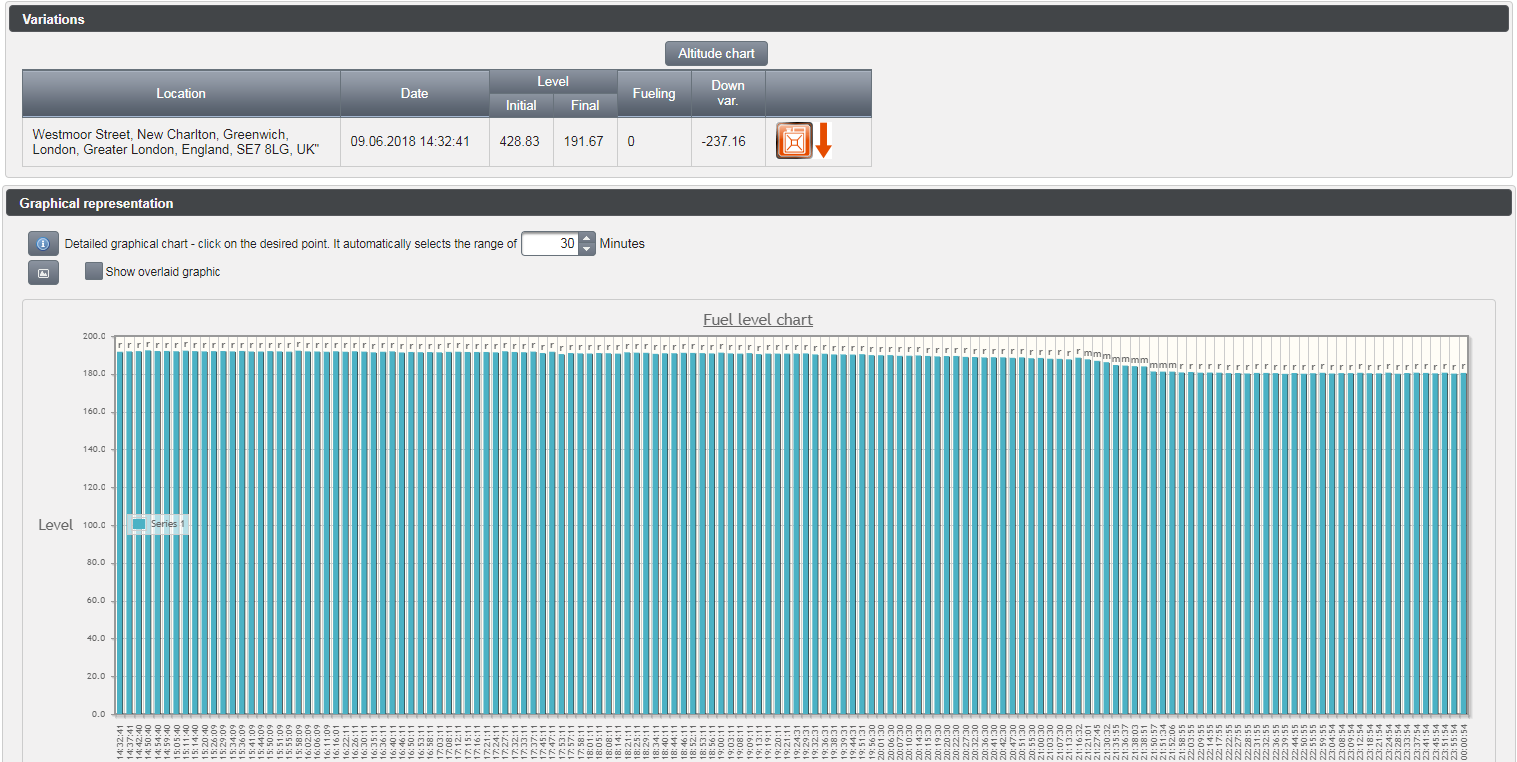
Fuel Level Report
The fuel level graph displays information such as the distance traveled, the initial / final fuel level, the fuel quantity, the lithium consumption, l / h, l / 100km, the address of the location where the diesel fuel was evacuated / eviscerated, the liter quantity of the event, fuel level in the tank.
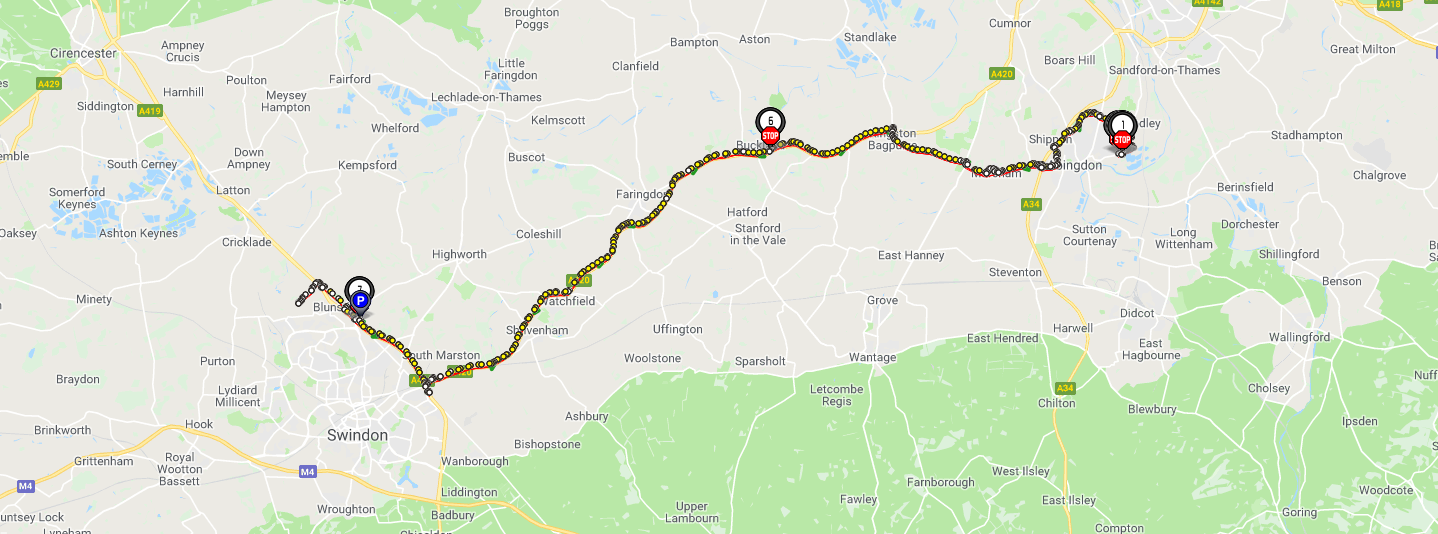
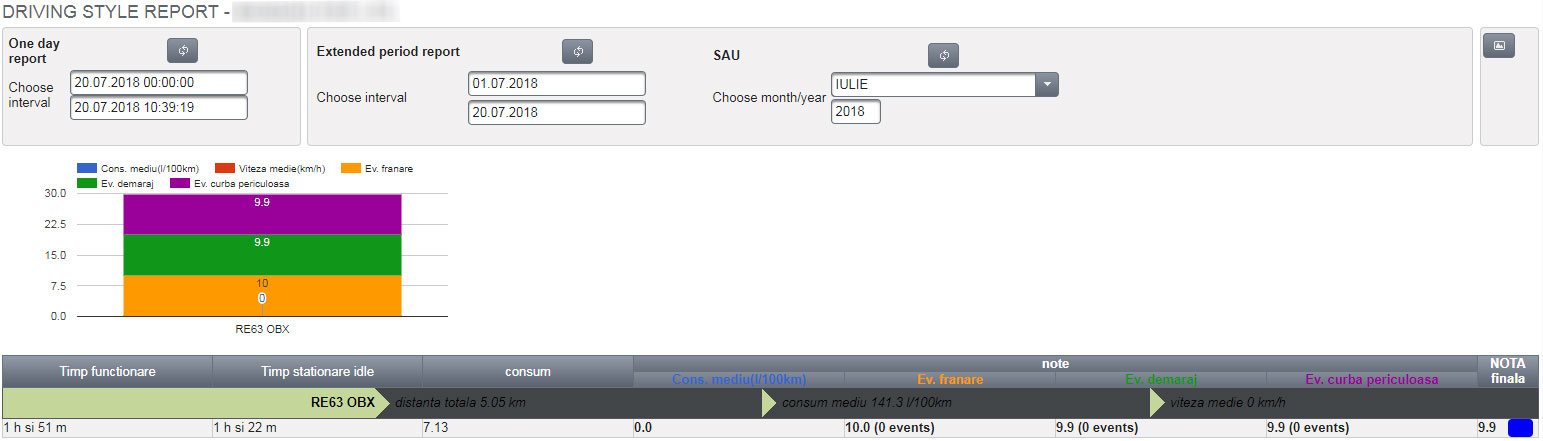
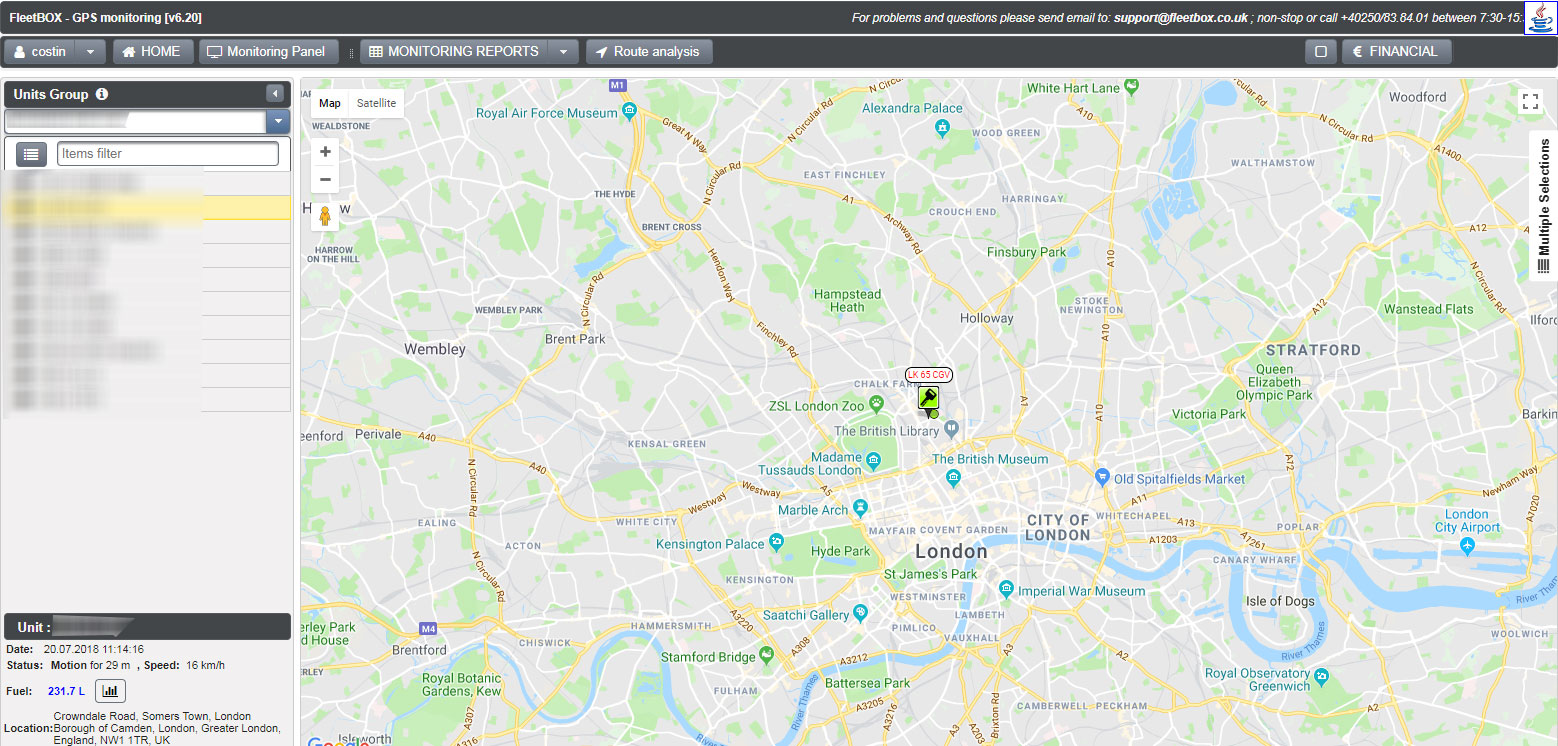
Movement Report
The daily map report is interactive and displays information with the exact location of the unit, the exact time at which the engine started / stopped, the parking time at each location, the time and travel speed on the road segment. The map is customized with speed display, locations where it was stationed with the engine running, fuel location / fuel.